
Analytics Business Dashboard 3.0
Boost business performance using dashboard tool data
The various analytics dashboards give you a detailed overview of your data and revenue, allowing you to make data-driven decisions to optimize your funnels and marketing campaigns, for example.
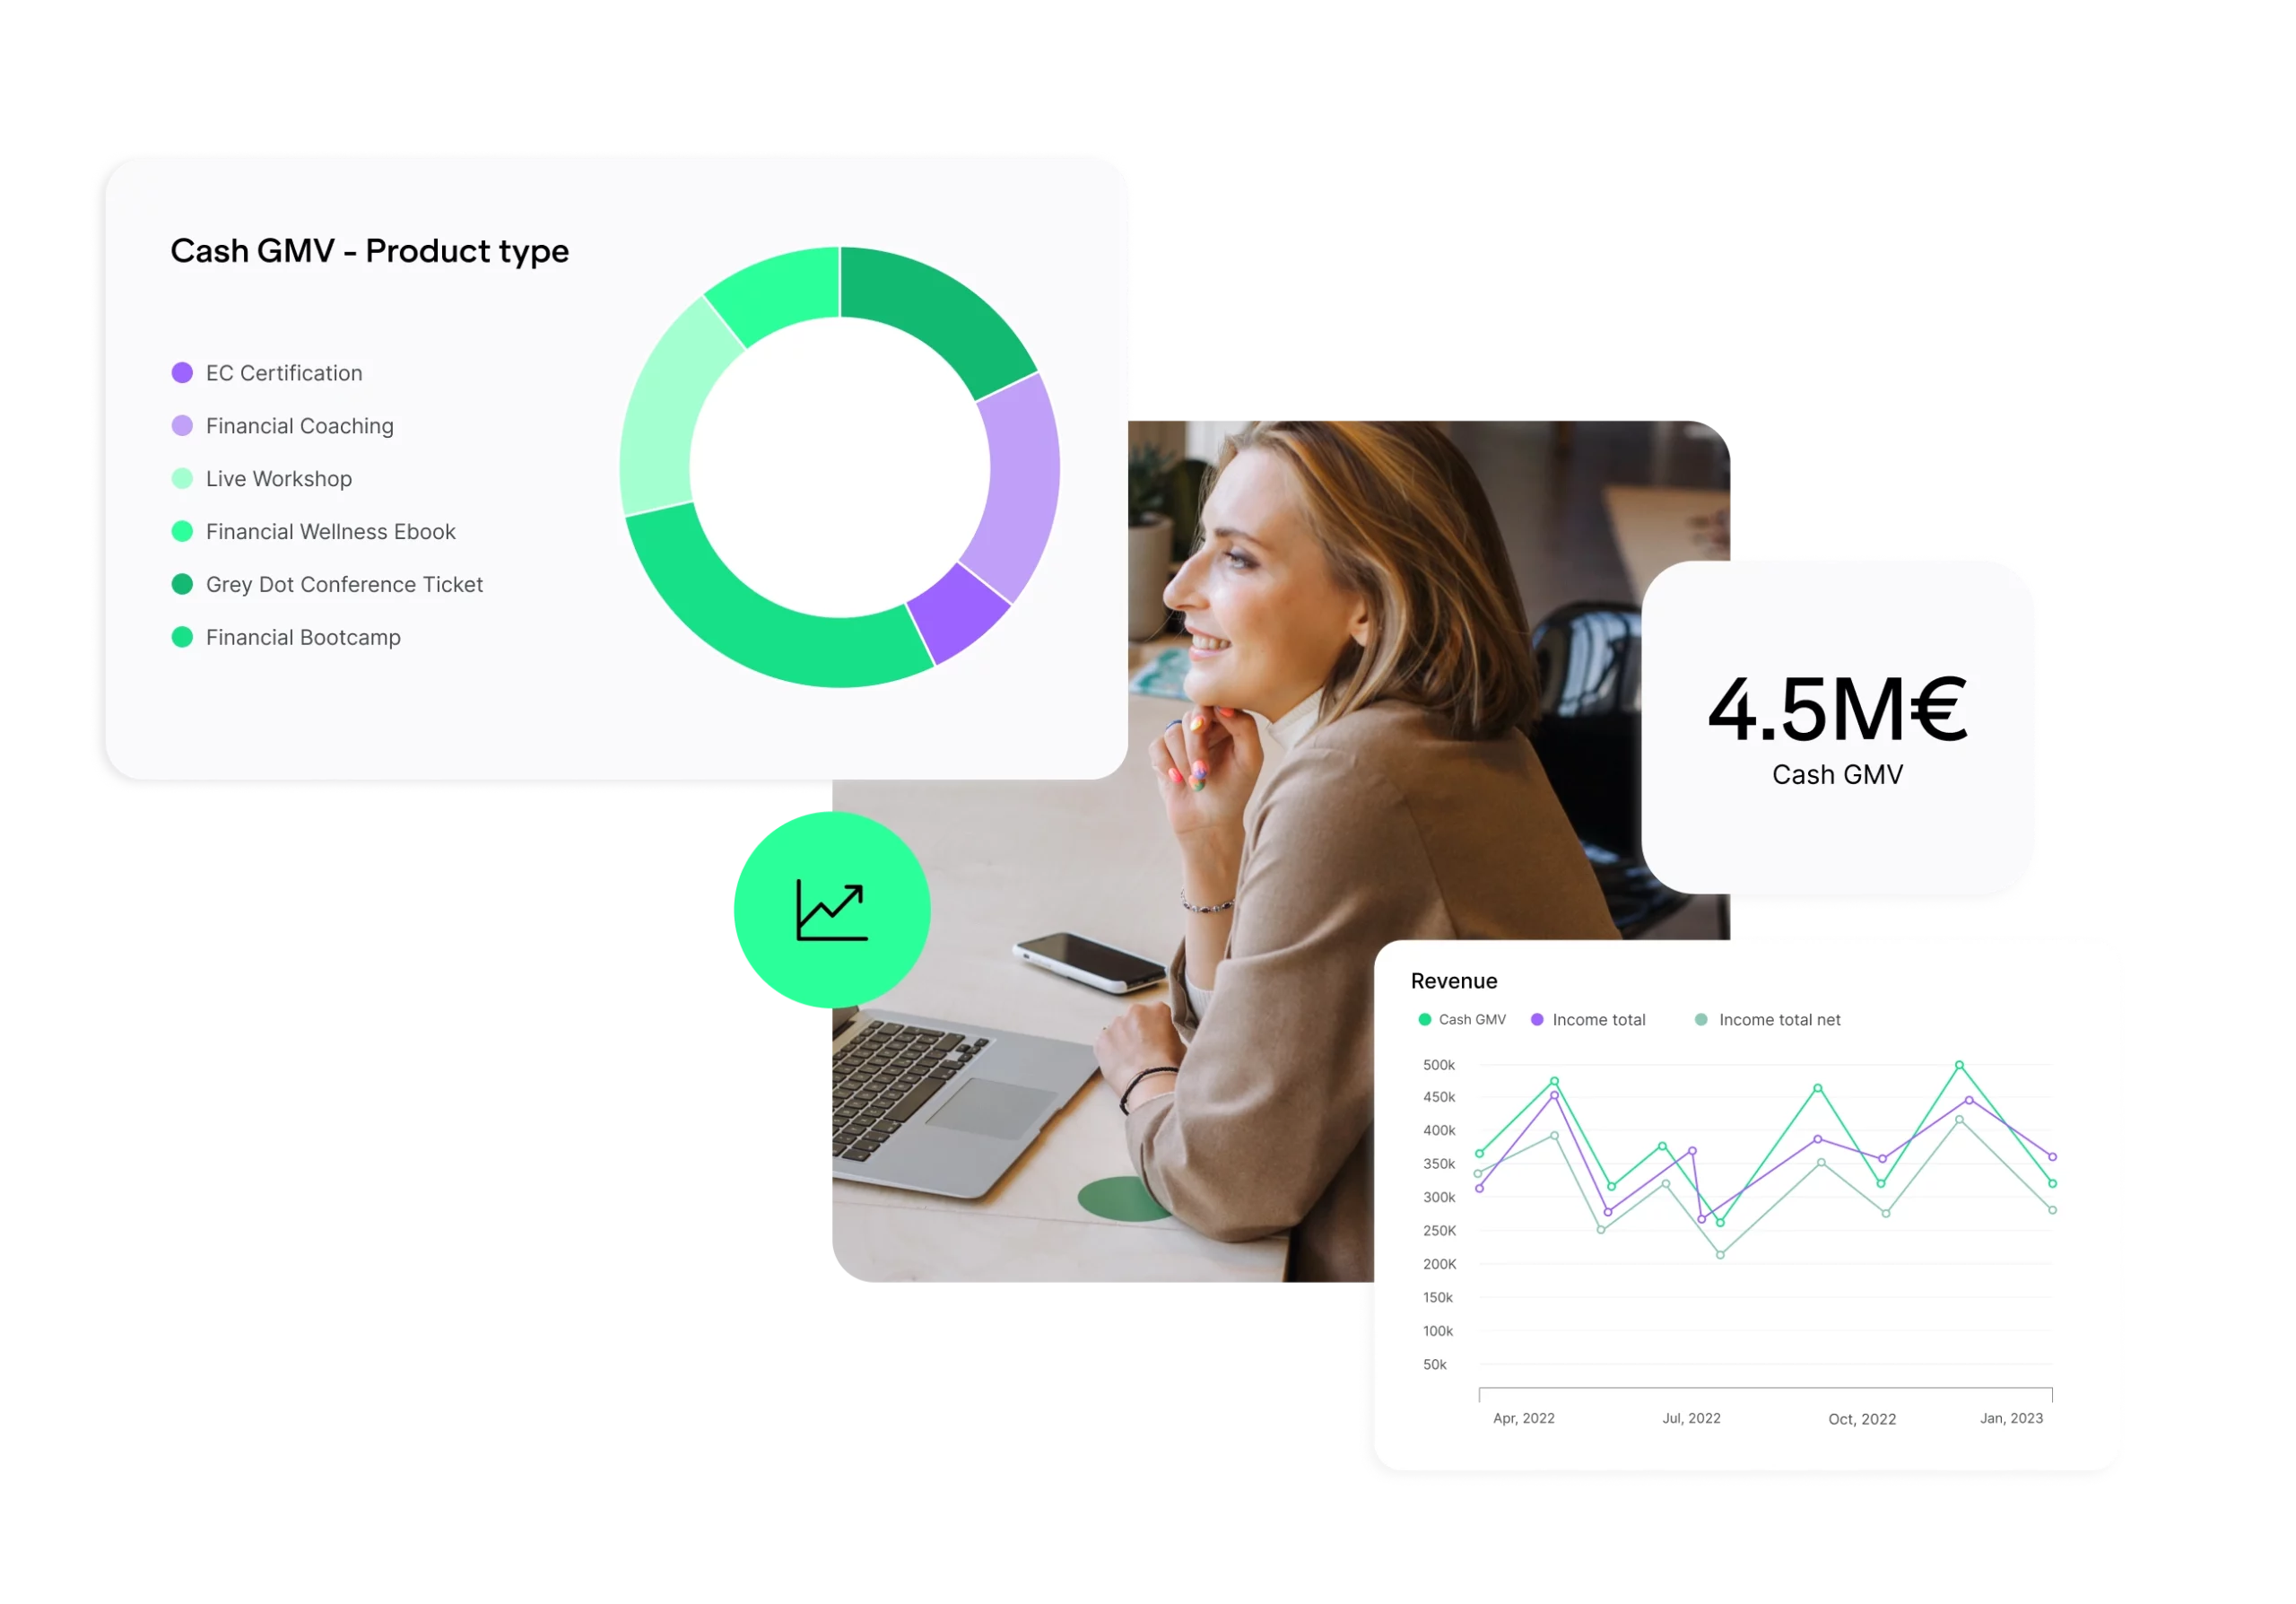
Highlights
The Benefits of Analytics Dashboard 3.0
Keeping Track of Revenue and Cash Flow
Upcoming payments, refunds, and chargebacks—all in one place. This way, you'll know what incoming payments to expect in the coming weeks.
See where your purchases come from
Traffic, conversion rate, and campaign performance. You'll see which channel generates orders and which one just generates clicks.
Recognize Business Potential
Analyze your data and identify opportunities to generate more revenue for the successful growth of your business.
Reduce Deficits
Identify the weak points of your business activities to optimize your business model and reduce your business expenses.
Know the Right Metrics for Your Business
Get detailed insights into performance, user behavior, and KPIs to make data-driven decisions and drive targeted growth.
Company dashboard
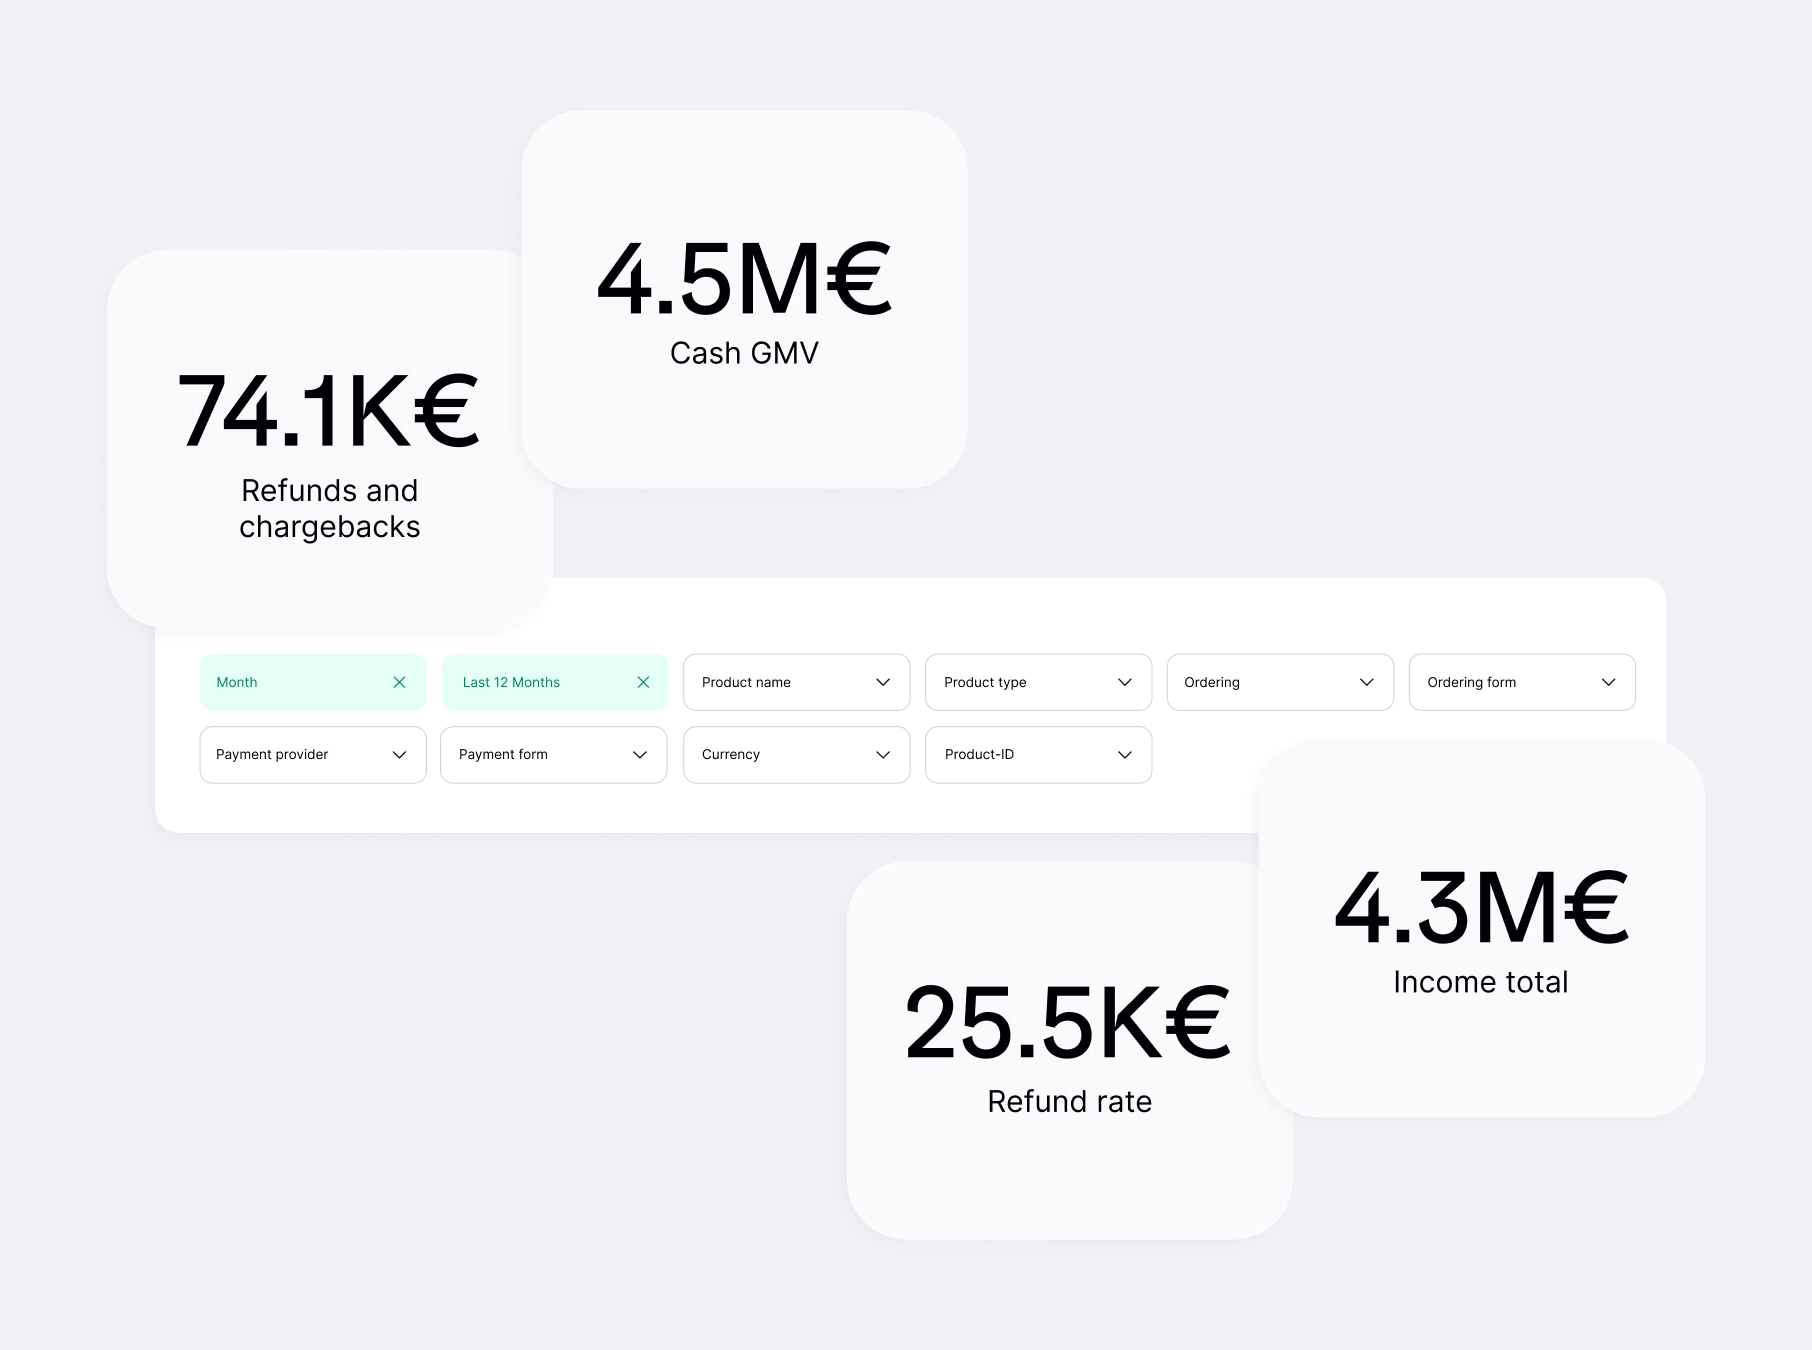
Centralized view of all available information for regular business planning and evaluation.
Visualization
Appealing visualization of data to quickly capture complex information, trends, and patterns.
Flexible KPI tracking
Filter the most important key figures in the company dashboard to keep an eye on your goals.
Usability
User-friendly interface and simplified navigation for optimized information search.
Drill-Down Function
Move from an overview level to a more detailed analysis to better understand correlations.
Dictionary
Understand your metrics and learn how to read the data to make informed decisions.
Dashboards
Your Business Dashboards
Revenues
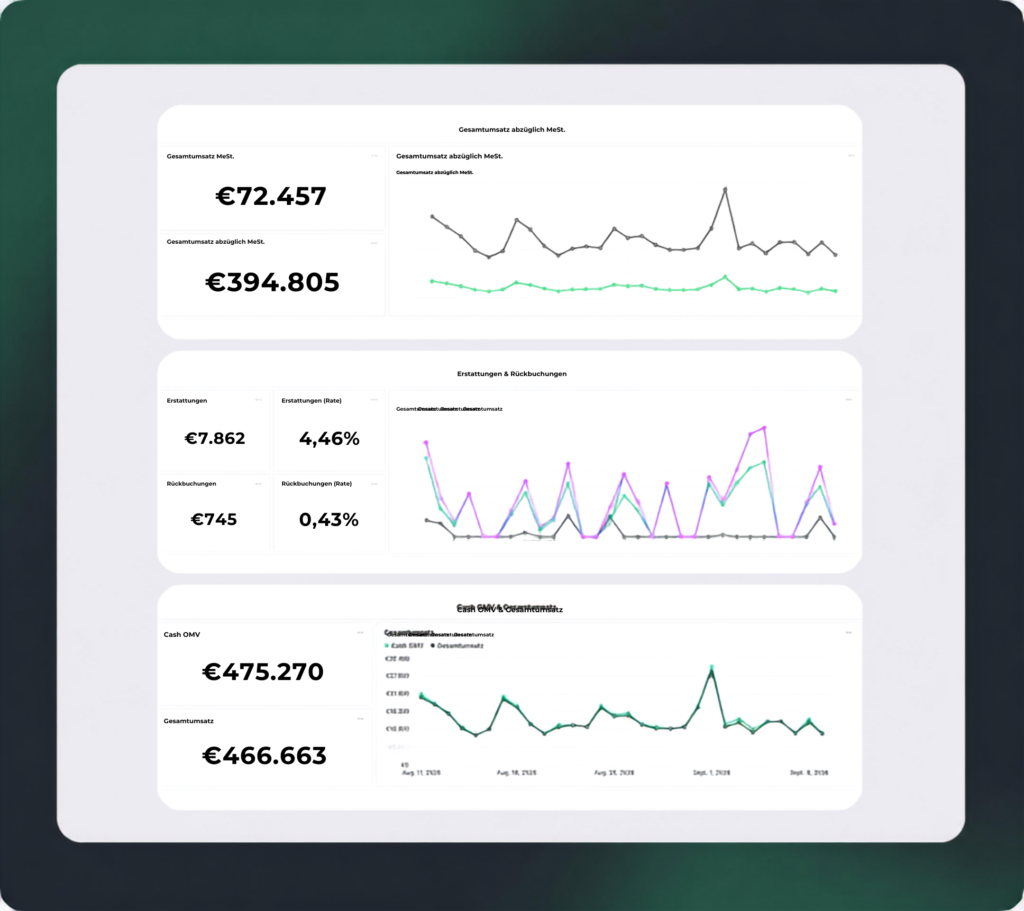
This dashboard provides you with an overview of your revenue figures and helps you identify key trends in your business.
Use it to track where and when your business is growing andto identify seasonal trends and recurring patterns early on.
Keep track of whichpayment provider is used most often.
Products
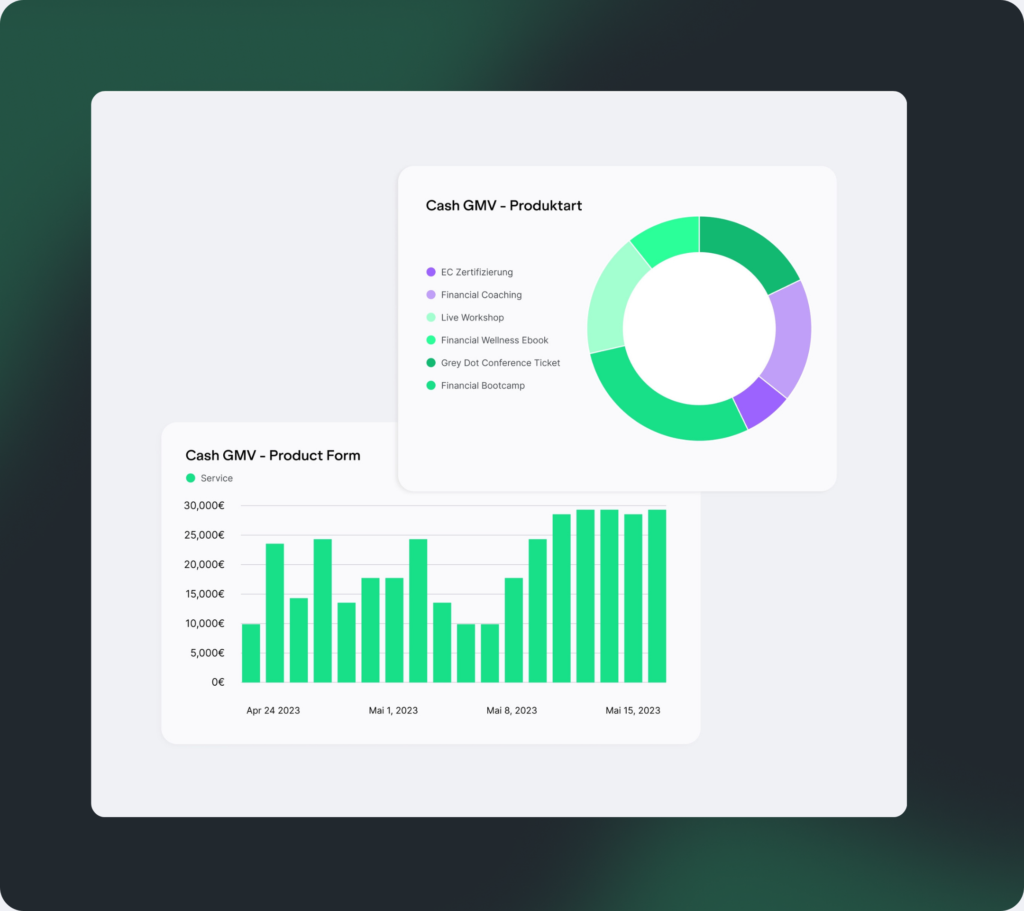
This dashboard shows you which offers are active and which are not: best-sellers, sales per product, and analysis by product category.
Use it before you create a new offer or remove an existing one from the lineup.
Customers
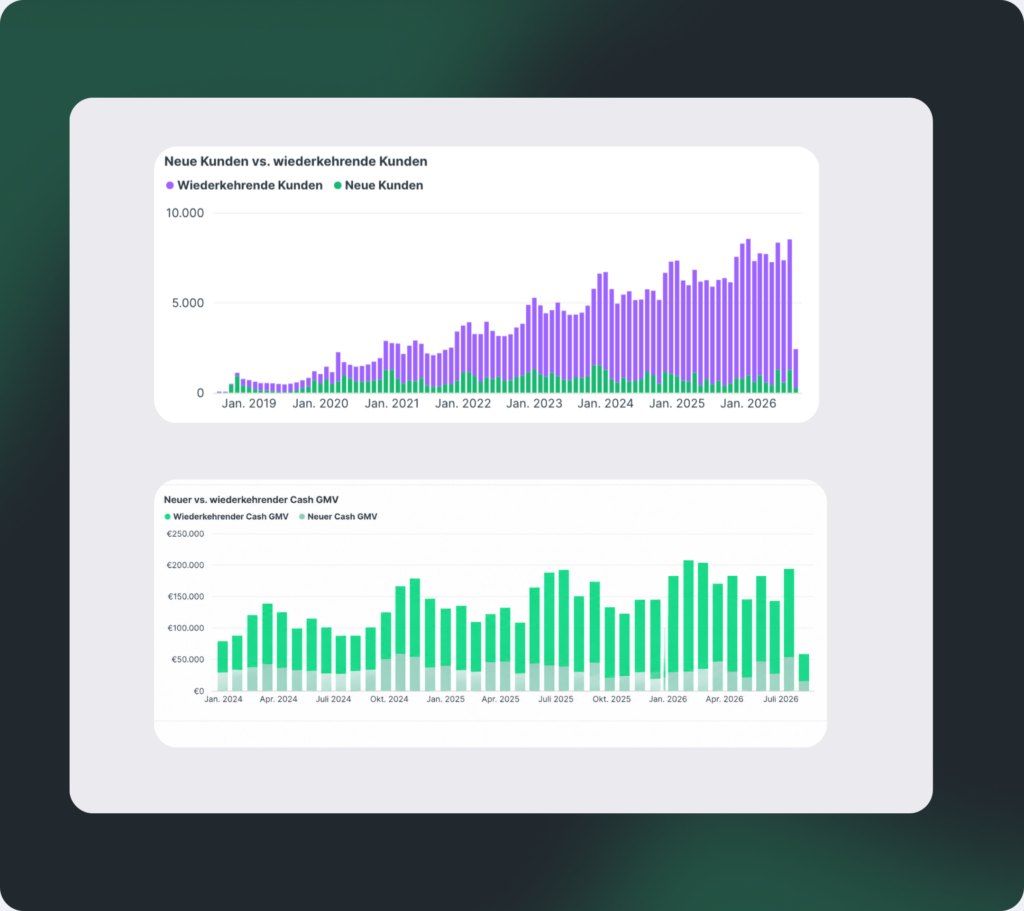
This dashboard gives you an overview of new, existing, and repeat customers, their lifetime value, and details about your top customers.
Find out whether your growth comes from new customers or from existing customers making repeat purchases.
Traffic & Conversions
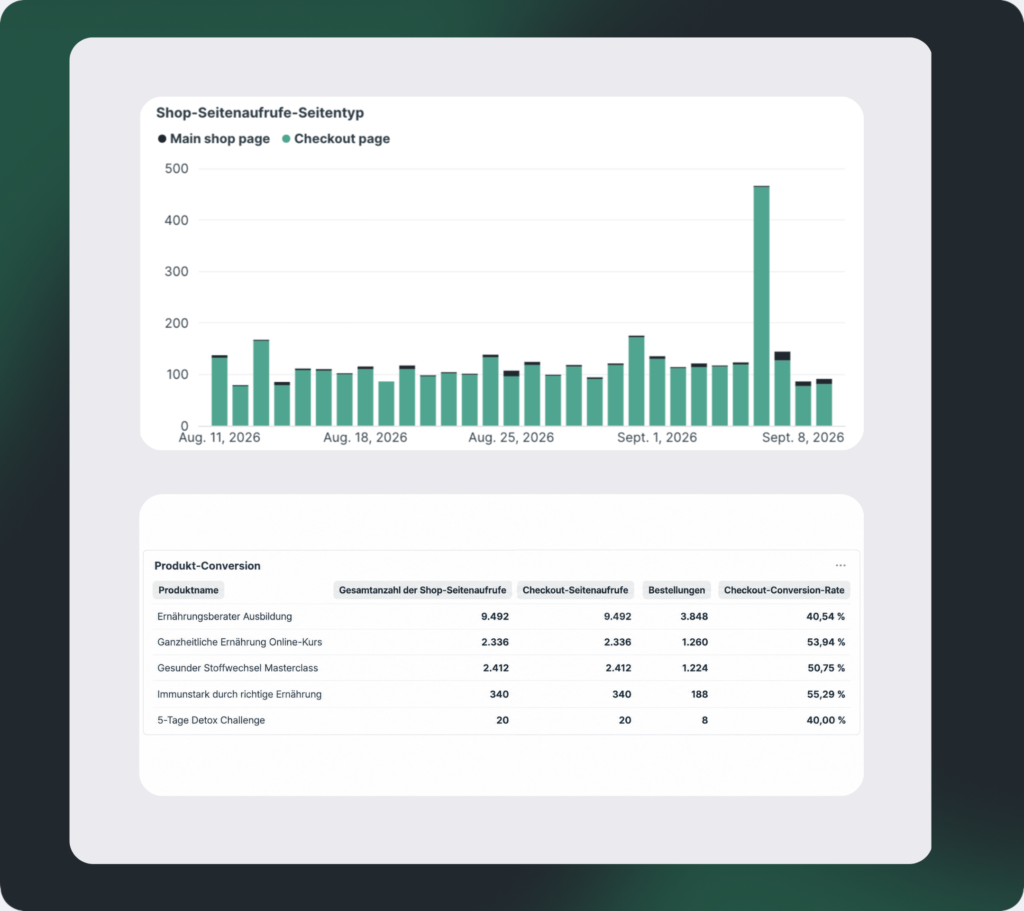
This dashboard gives you an overview of the number of visitors to your store pages, as well as the conversion rate from checkout pages to completed orders.
Use this if you want to learn more about the conversions from your offers so you can optimize your pages or ads.
Upsell Funnel
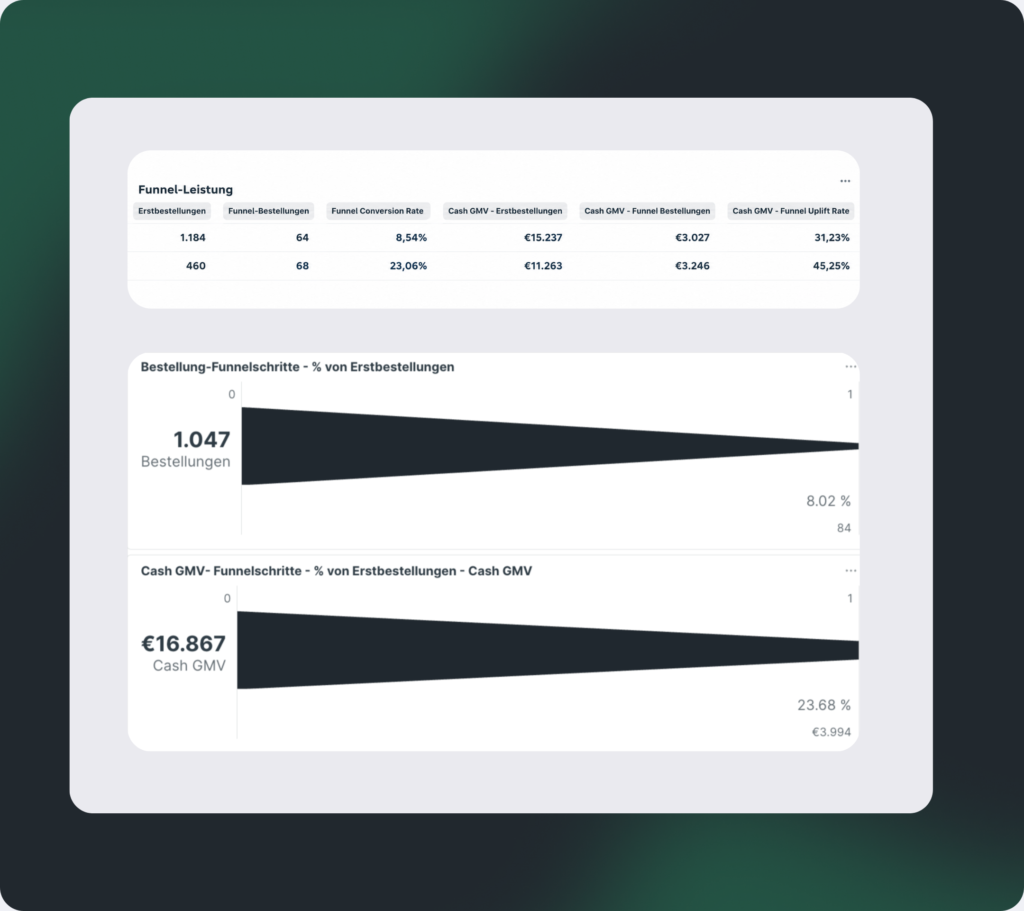
This dashboard shows you the performance of your upsell funnels —from the funnel as a whole down to each individual funnel step.
Use this if you want to know which funnel generates the most additional revenue and at which stage of the funnel you're losing revenue.
Order Bumps
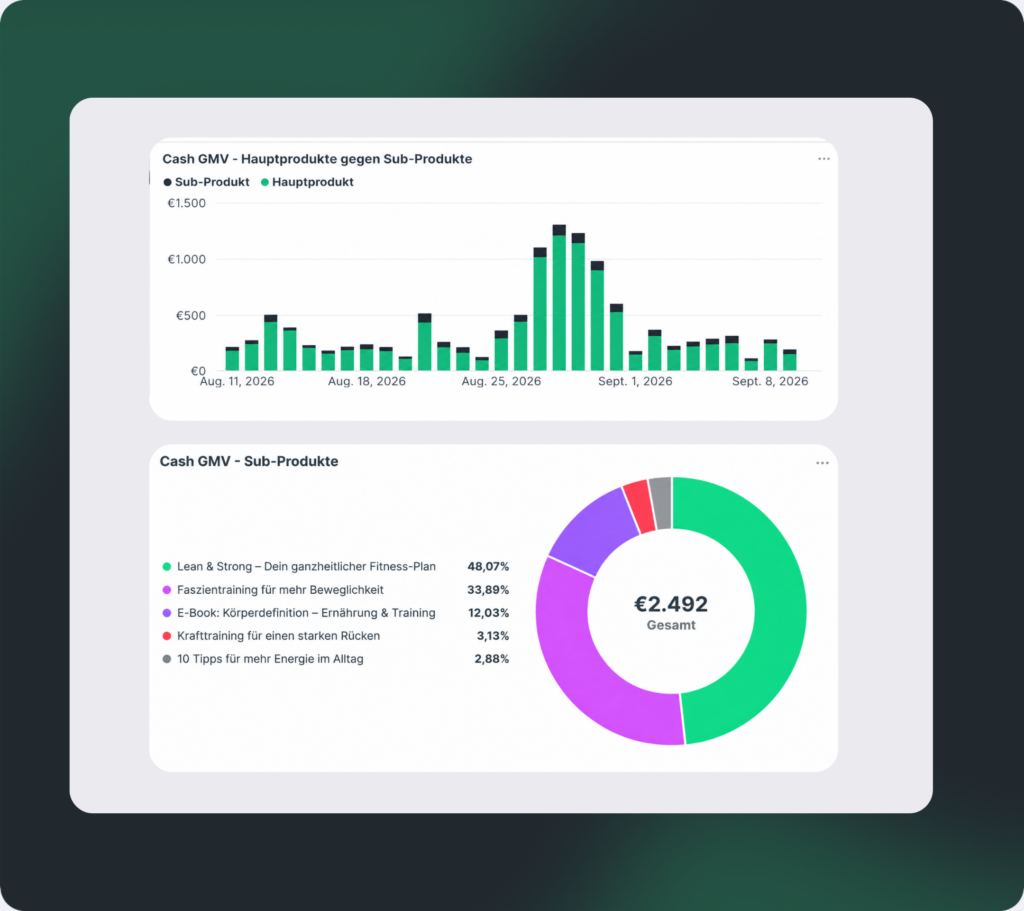
This dashboard shows you the performance of orders with order bumps.
Use it to see which add-on offers work best and generate the most revenue.
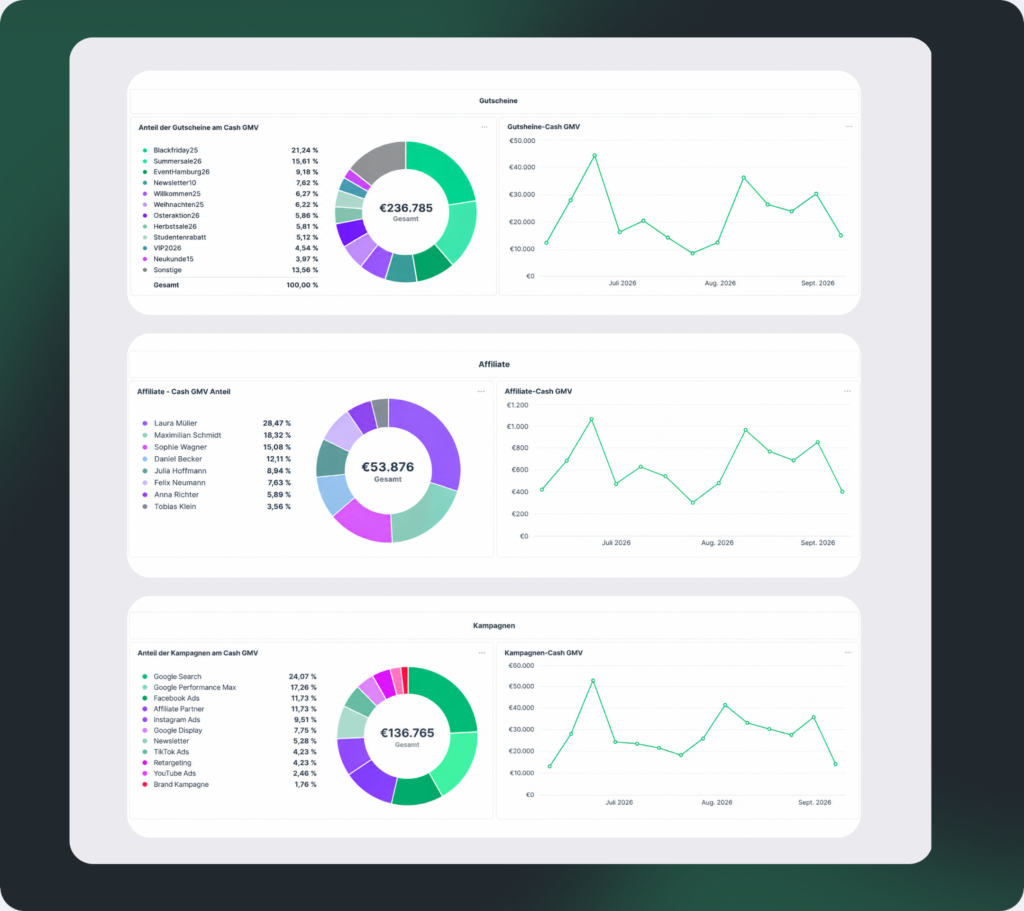
Marketing
This dashboard provides an overview of which coupons, affiliates, and campaigns generate the most revenue.
Use it, for example, to decide which campaign should receive more of the budget or whether coupons increase your sales.
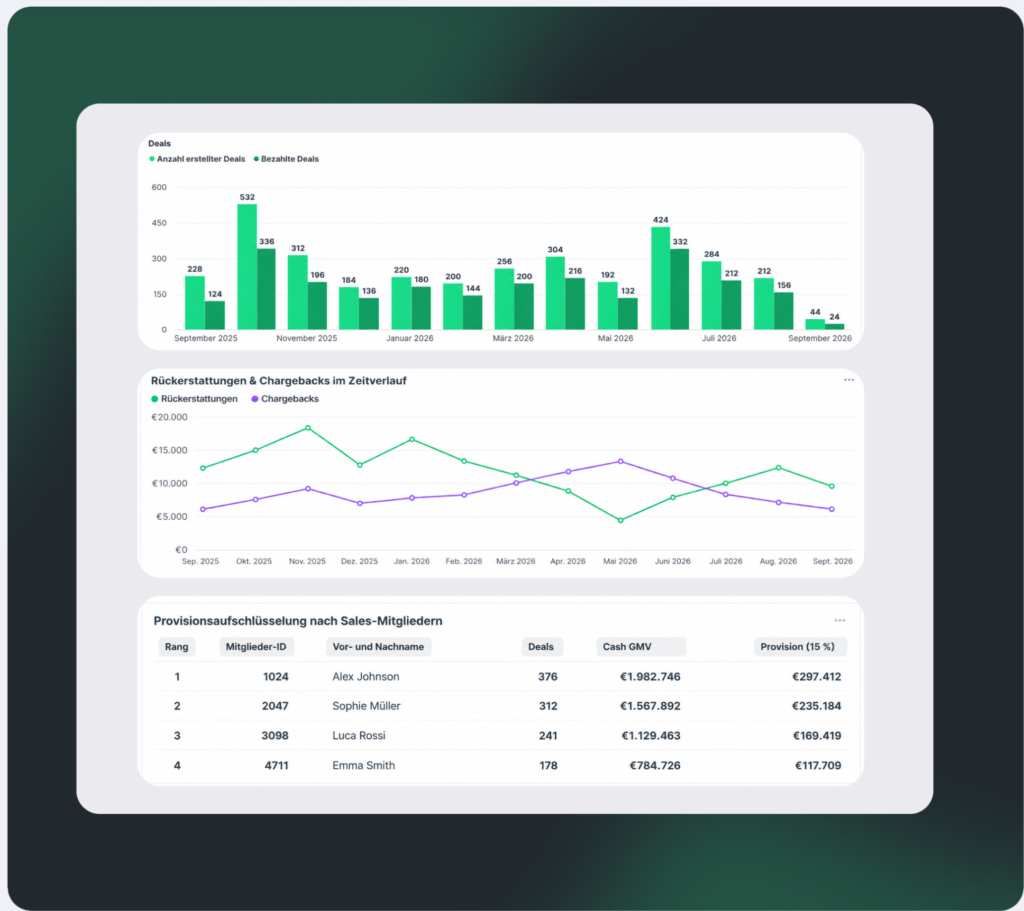
Sales OS
This dashboard shows you your sales team's performance, including deals, closed deals, and commissions for each team member.
Use this if you work with a sales team and want to track terms, closing rates, and commissions.
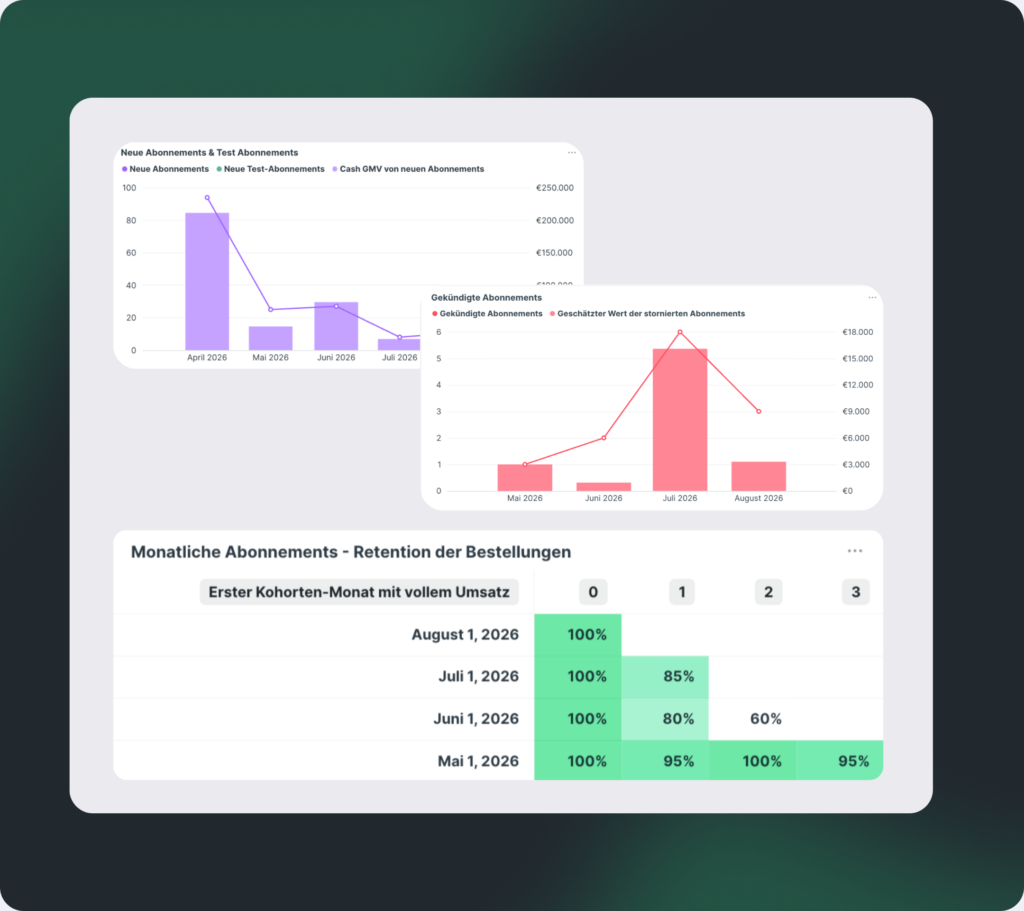
Subscriptions
This dashboard gives you an overview of how your (time-limited) subscriptions are performing.
Use it to understand your recurring revenue. Upcoming subscription payments, conversions from trial periods to paying subscribers, and cancellation rates show how predictable your revenue is.
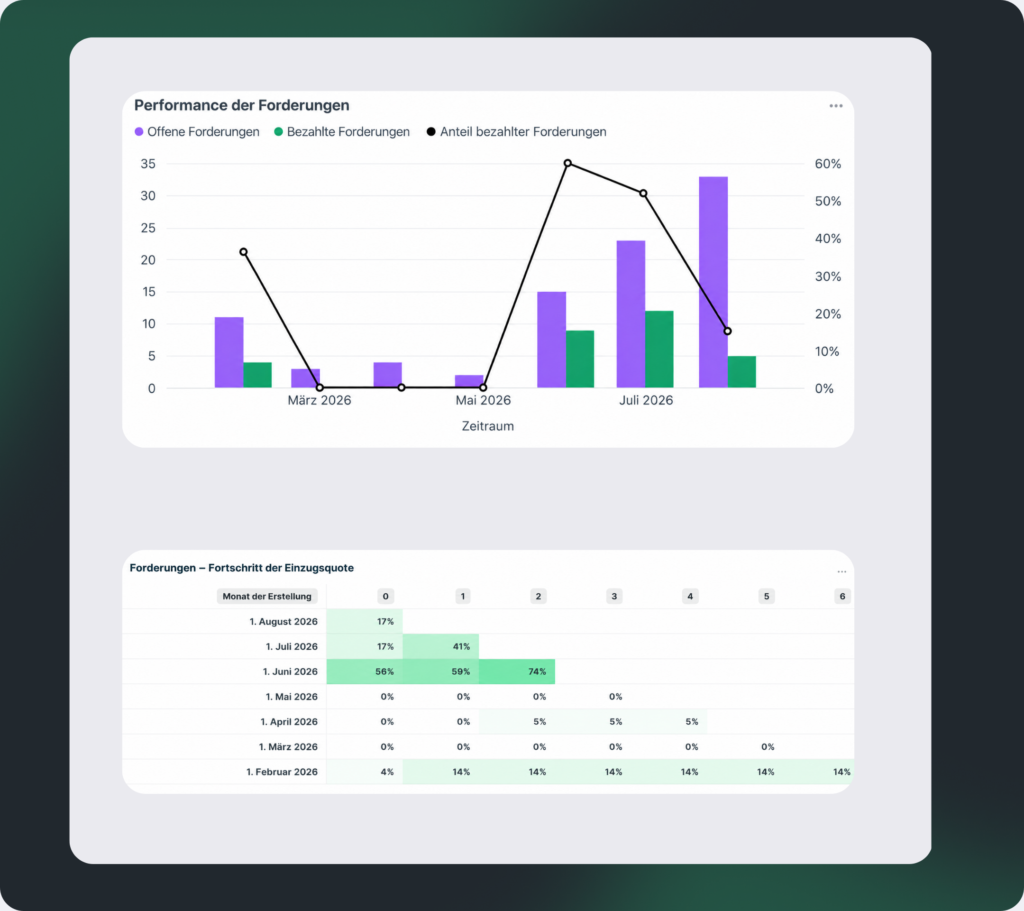
Dunning
In this dashboard, you can see the performance of your receivables and when and how much has already been paid.
Use this feature if you use our dunning and collections service and want an overview of outstanding and collected receivables.
COMING SOON
Central location for all analyses relating to your business
Use our sales platform and payment processing service to centralize all your activities in one place. With a Create & Sell plan, you can also host access to your content with us, such as online courses, memberships, and communities.
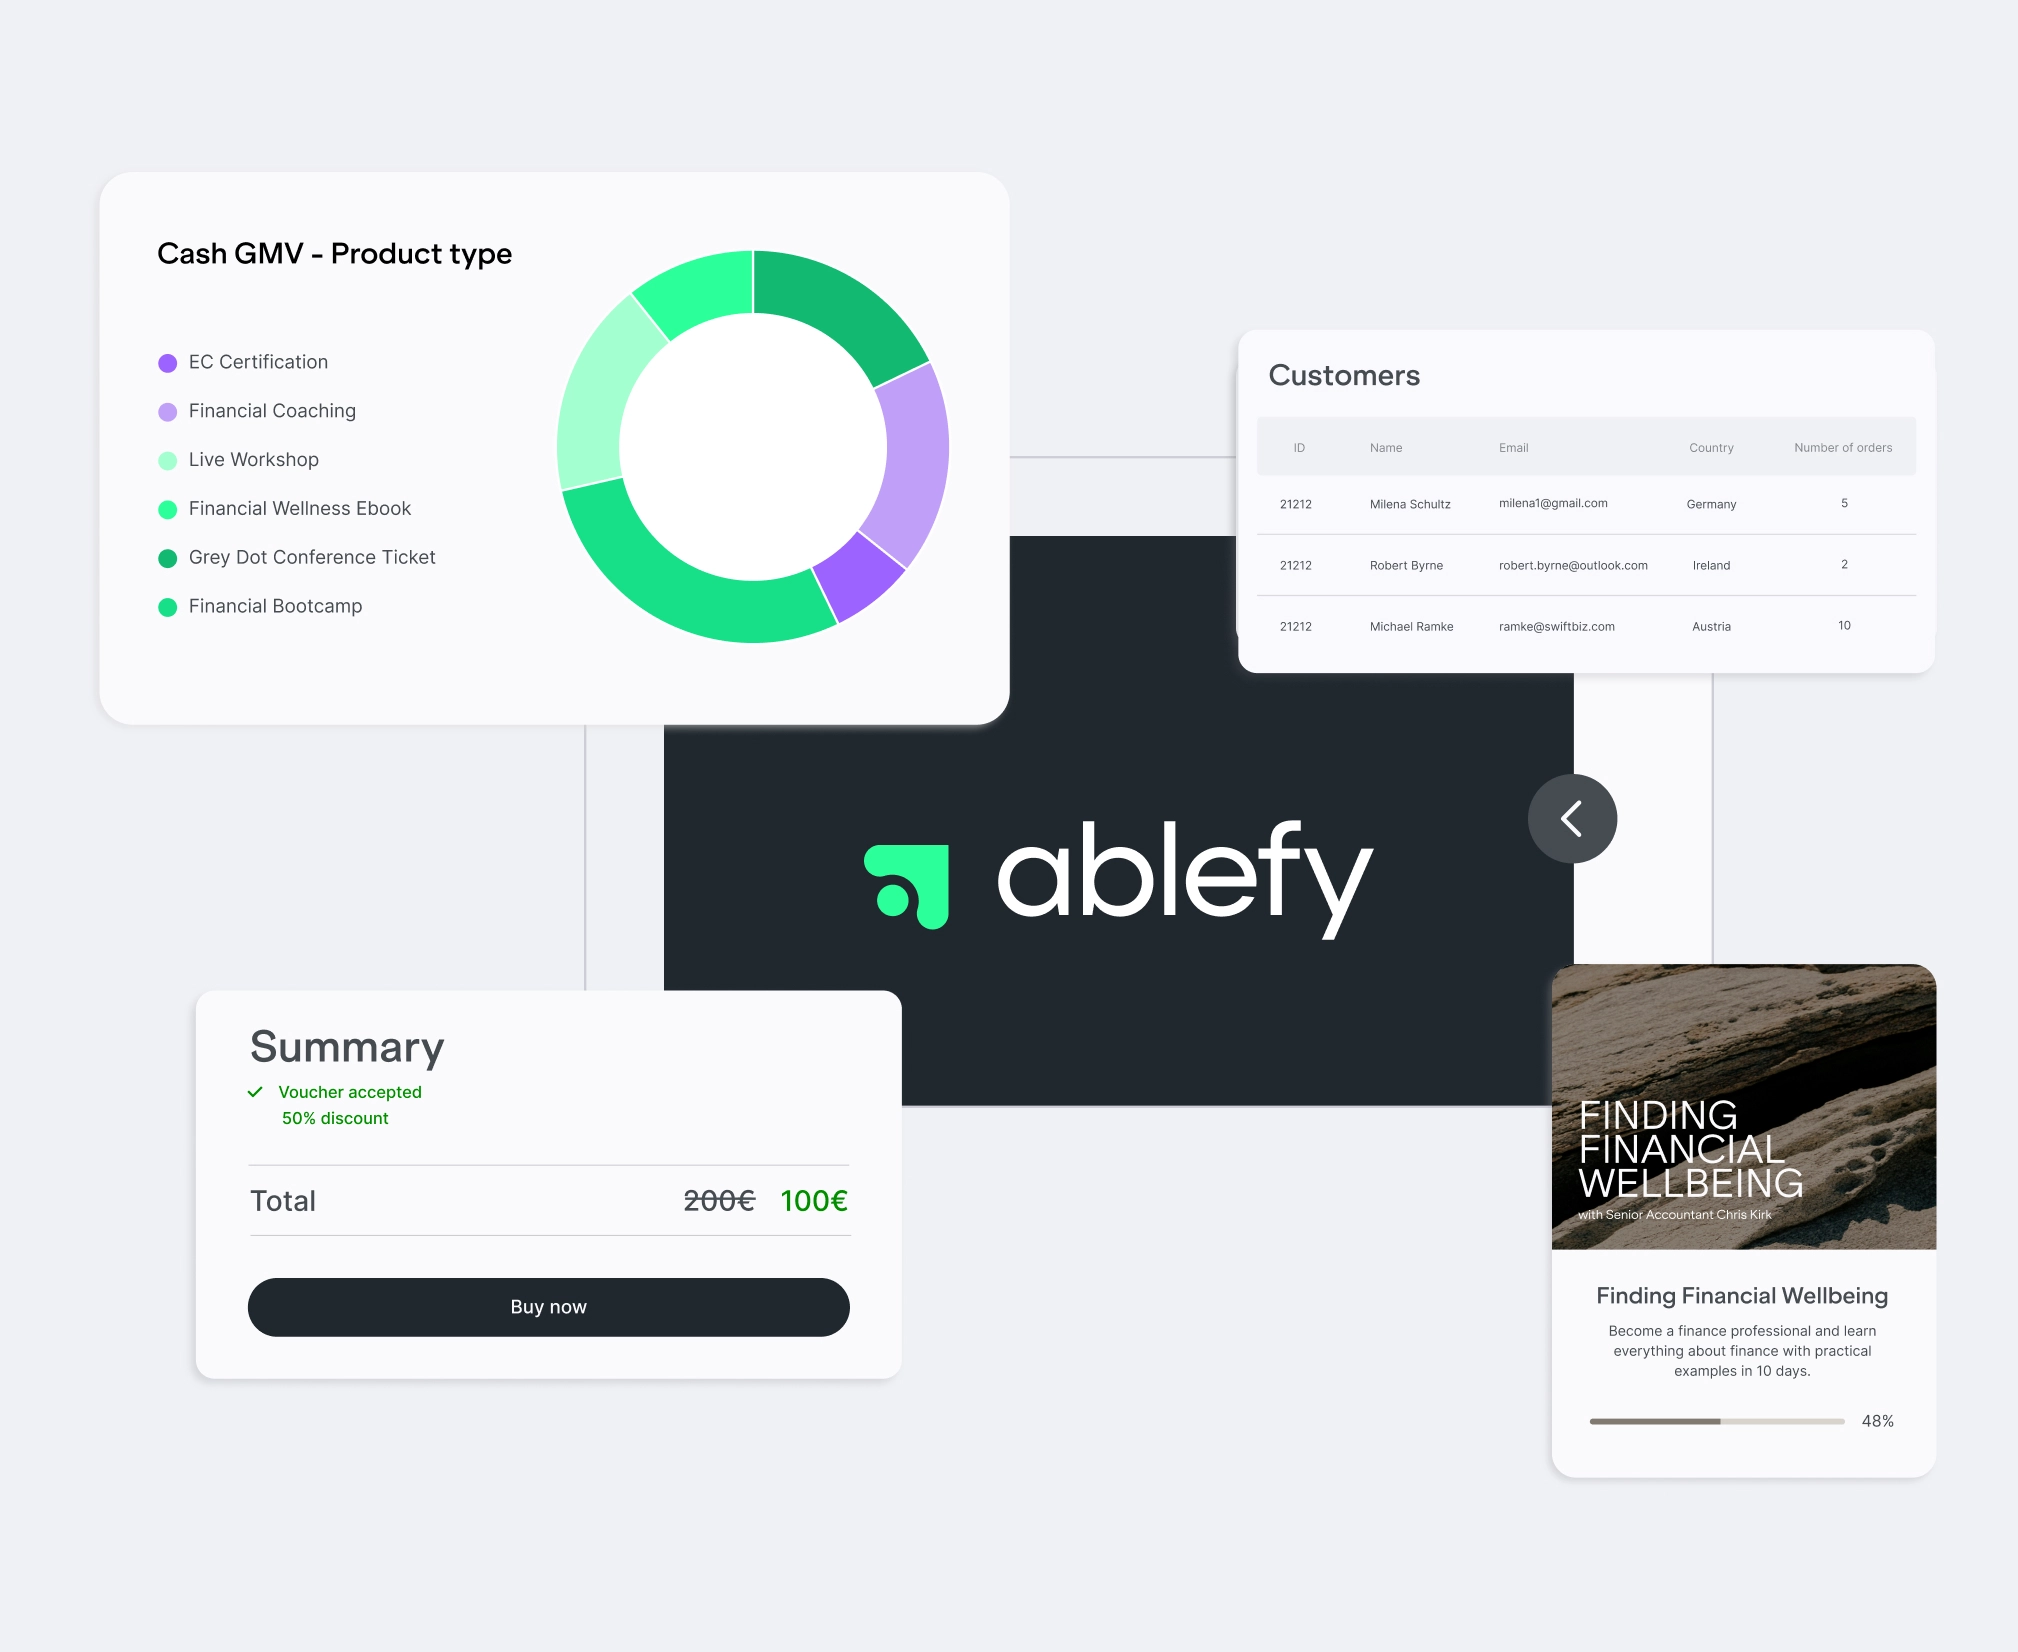
Payment Processing
Set up checkout pages with custom details, payment options, tax rates, and return policies. Use conversion tools such as countdown timers, social proof bubbles, or limited-time special offers.
Order management
You can view all relevant customer information in your order overview and cancel orders or individual payments. If payments are overdue, you can have reminder emails sent automatically or subsequently refer the outstanding amounts to a collection agency.
Customer management
All buyer information is available in your order summary. In the Customers Analytics dashboard, you can learn more about your customers and their purchases.
Product delivery
Your products will be automatically made available to your customers once payment has been successfully received. If you're using the Create & Sell plan for your online courses, membership areas, or communities, access will be automatically revoked if the next payment is not received.
Marketing automation
Activate built-in marketing tools and expand your funnel communication to position your offers effectively. Use our marketing tools to create custom links, such as for A/B testing of the payment page, coupon codes, or special prices.
Tracking
Connect tracking tools such as Tag Manager, Analytics, or Facebook Pixel to your business for even more insights. Connect your Tracify or Trackleads account to ablefy.
Use cases
Make Smart Business Decisions Every Day
Make Data-Driven Decisions for Your Business Success
Smart dashboards with understandable displays to make the most of your data:
- Keep track of your sales revenue and determine the financial performance of your business
- Analyze return and refund rates to decide customer satisfaction and quality of products
- Increase conversion rates and understand where customers are dropping off to place effective sales strategies

"Since switching to ablefy, we have gained more than 1,000 customers and generated multiple 7-figure sales."
Founder & Business Expert,
Classy Confidence GmbH

"It has never been so easy to sell digital products. I can focus entirely on my courses and constantly improve them - ablefy does the rest for me."
Founder, VA:Preneur
Identify Trends and Act Successfully
Make forecasts on products, customers, and costs:
- Evaluate the number of products you sell and identify best sellers and trends
- Identify shopper behavior and establish shopping patterns of your customers based on top buyers and recurring purchases
- Analyze your cash flow and anticipate average profits and chargebacks for similar product strategies

